Sorry for this interruption of my regularly scheduled sporadic journal entries, but I have something cool to share.
As you may have noticed from my journal entries so far, I often observed (complained about?) a huge difference between the map elevation profiles and actual ascent/descent on the ground. Well, I wanted objective data to find out if this was just my weary mind over-exaggerating the climbs or the elevation profiles being overly-smoothed.
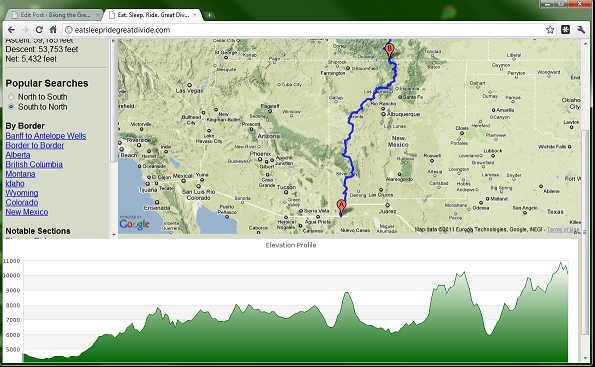
So I plotted the route on Google Maps and wrote some code to show precise elevation gains/losses for any section of the Great Divide. As a cool addition, the application also shows an elevation profiler for any selected section. Check it out at eatsleepridegreatdivide.com. If you’re planning on riding the Divide this year or racing the Tour Divide, you may find it useful.
*Special thanks to Scott Morris and TopoFusion for the uber-detailed GPX data.

Hey, thanks for taking the time to post your blog entries and this great map on the Divide trail. Super helpful in planning for the TD and much appreciated.
Thanks,
Niki